
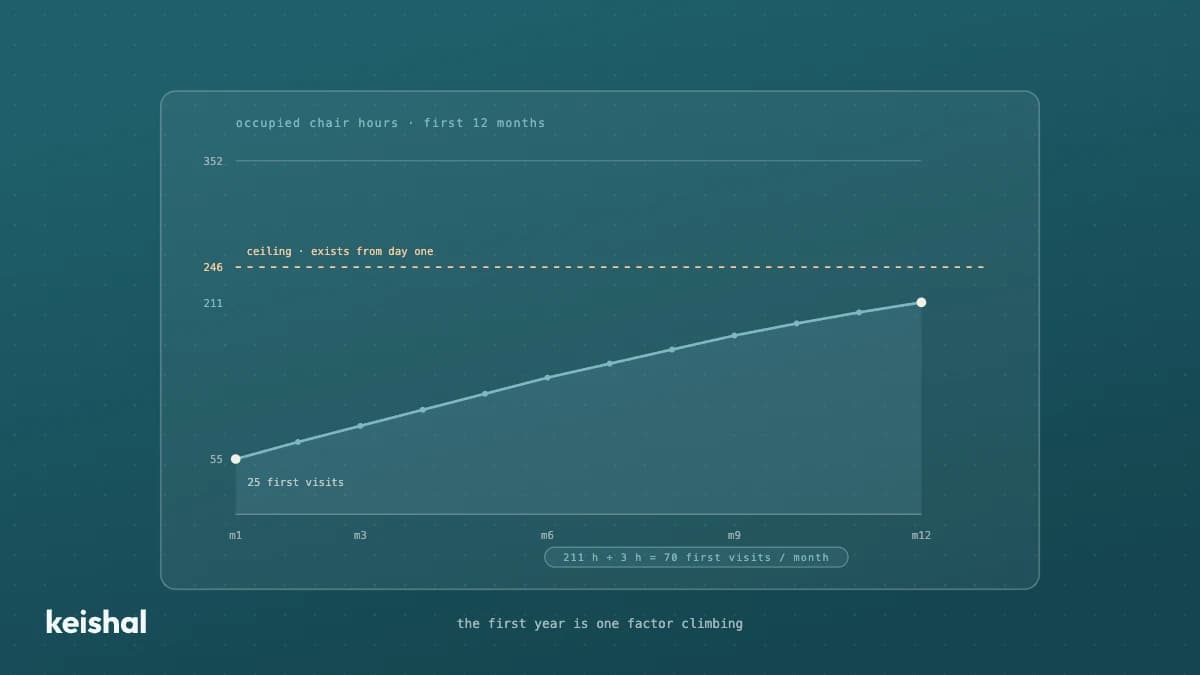
No published first-year average is defensible: they mix clinics, models and cities, and almost never show where the figure comes from. The useful answer is a curve you calculate with your own numbers. Your structural ceiling (chairs × available hours × € per occupied hour) exists from day one; what sits at zero is occupancy. Example: for 60 % occupancy in month 12 with 2 chairs (352 available hours) you need around 211 occupied hours a month; if each new patient generates around 3 chair hours, that is around 70 first visits a month. That division — the hours you want to fill divided by the hours each new patient brings — is your first year, and in 2026 there is still no report that does it for you.
If you are about to open a clinic, or opened one a few months ago, you have probably searched for how much a dental clinic makes in its first year. The search returns comfortable figures: consultancies and franchises publish averages that almost never come with their derivation. You will not find another average here. You will find something more useful: the shape of the curve, and a division you can do today with your own numbers. For example, this one: if you want to fill 211 chair hours a month one year from now and each new patient brings you around 3 hours, you need around 70 first visits a month. The rest of the article explains where every number comes from.
Why we are not publishing the average you came looking for
The first-year averages in circulation have two problems. The first: they mix things that cannot be mixed. A neighbourhood clinic with 2 chairs, a franchise with a known brand and a dentist going independent with half an agenda from a previous job do not share a first year. Averaging them produces a number that describes none of the three.
The second problem is simpler: almost nobody shows where the figure comes from. Our editorial rule is that if we cannot show you a number's derivation, we do not publish it. We do not have a first-year average we could defend, so you will not read one here.
What can be calculated, with your numbers and the arithmetic in plain sight, is the shape of your curve. That is what we do next.
Your billing ceiling exists from day one; your occupancy does not
For a running clinic we already wrote how to calculate how much your structure could bill: chairs × available hours × occupancy × revenue per occupied hour. That structural ceiling also exists on the day you open.
An example with round numbers. With 2 chairs open 176 hours a month you have 352 available hours. If your average revenue per occupied hour is €90, your ceiling at 70 % occupancy is around 246 hours: around €22,100 a month. Substitute each factor with your own.
The difference with the established clinic sits in a single factor. Chairs, hours and prices exist from the first day. Occupancy does not: on day one it is zero. The first year is the story of that single factor climbing. That is why the useful question is not "how much do clinics bill", but how fast yours fills up.
The arithmetic of the curve: how many first visits you need
Three steps, each with your own numbers.
- Choose your target occupancy for month 12. Be realistic: a new clinic should not aim for the 85 % of an established one. At 60 % of 352 available hours, your target is around 211 occupied hours a month.
- Work out the hours each new patient brings. A first visit takes around one hour between examination and diagnosis. Some of those patients accept a treatment plan that adds several more hours. If with your mix each new patient generates on average around 3 chair hours over their first months, use 3. A very surgical clinic will have more hours per patient and need fewer patients; one focused on check-ups, the opposite.
- Do the division. 211 hours ÷ 3 hours per patient ≈ 70 first visits a month once the curve is at cruising speed. That is the figure your first year depends on. Where those visits come from is exactly the question of how to get more patients for your clinic.
The same arithmetic explains month 1. With 25 first visits you will have around 25 hours of examinations plus the first accepted treatments: perhaps 50 or 60 occupied hours in total, between €4,500 and €5,400 at €90 an hour. The distance between that month 1 and month 12 is your curve, and it is normal for it to be large.
Two limits worth admitting. The curve is not linear: there is seasonality, start-up months and treatments billed in stages. And the 3 hours per patient are a working average your real mix will move. Once you have a few months behind you, the forecast for next month is better calculated from your own history than from any template. It is one more reason to record data properly from the first day.
The three deposits that sit at zero on day one
An established clinic bills, above all, thanks to three accumulated assets that appear in no business plan: patients who come back, a reputation that attracts, and an agenda with inertia. The new clinic starts with all three at zero, and the speed of your curve is the speed at which you fill them.
The patient base. In a clinic with years behind it, much of the agenda fills itself with check-ups and ongoing treatments. In yours, during the first year, practically 100 % of the agenda depends on first visits. That is why the division above rules, and why the order of acquisition matters more than any single channel.
The review base. A patient who does not know you decides by looking at your profile and your reviews, and on day one you have zero. Most satisfied patients write nothing if nobody asks: as we saw when explaining how to get Google reviews, 5 spontaneous reviews out of 600 visits is under 1 %. In a new clinic, every first visit without a review request is doubly expensive: you lose the review and you stay invisible to the next patient.
The agenda with 24/7 capture. Your clinic will be open around 50 of the week's 168 hours: that leaves 118 hours, 70 %, in which someone who discovers you cannot call. A full clinic can afford to lose a contact. For a newly opened one, that contact was one of the 70 first visits it needs this month. 24/7 online appointment booking turns that late-night discovery into a firm appointment: the patient asks over WhatsApp and picks their slot in a calendar link.
"We opened in March. The first two months we lived off friends and family. The scare came in the third, when the agenda depended on strangers and nobody knew where the next first visit would come from." This is a summary of 2026 sales conversations with first-year clinics, not a verbatim quote, and it describes the pattern better than any chart.
What to install from day one so that month 13 exists
Month 13 is the first wave of check-ups: the patients from your month 1 who should come back. That wave does not appear on its own; it is built during the year with three habits that cost far less when installed from the start.
A complete record from patient number 1. Verified mobile number, recorded communication consent, treatment and date properly noted. In an established clinic, cleaning the database is a project; in a new one it is a free habit, because recording data well costs the same as recording it badly and the difference only shows a year later. Every incomplete record today is an uncontactable patient in month 13.
The review is requested at the first visit, not "when we have time". The reputation deposit only grows if the request is systematic from visit number 1.
24/7 booking from the first week, because 70 % of your week is closed from the very day you open.
And one piece of structural honesty: reactivating dormant patients, which in an established clinic is the most profitable lever, does not apply to you yet. You have nobody to reactivate. Trying would be optimising an empty deposit. What does apply to you is not losing the data of a single first visit, which is exactly what will make it possible, two years from now, to reactivate the people walking through your door today.
If you can only install one discipline in the first month, our opinion is clear: the complete record. The other two can be added later; the data you did not keep cannot be recovered.
This question looks like three others, and it pays not to mix them
- "How much could my structure bill?" is the ceiling question: calculate yours when you want to know what your clinic gives at full speed.
- "Am I really making money?" is the margin question: profitability answers it, with the cost per chair hour and your coverage threshold.
- "What will I bill next month?" is the forecasting question, and it is answered from your recent history.
- "How much will I bill in the first year?" is this one: the speed at which your occupancy approaches a ceiling that is not yet yours.
And an autonomous system, in the first year?
An autonomous system like Keishal operates the non-clinical side of the practice on top of the software you already use. In the first year, that means four concrete things: it answers the questions that arrive out of hours over WhatsApp and escalates to your team the ones that need it; it sends the calendar link so the patient books on their own; it requests the review after the visit; and it writes every appointment, every confirmation and every contact detail into your practice management software, whether that is Gesden, Nubimed, Dentalink, Clinic Cloud or another. The complete record stops depending on anyone's memory.
And what it honestly will not do yet: reactivation at scale. With 200 patients in the base there is nothing to reactivate; the part of the system that decides who to bring back starts paying off once the base exists. The advantage of setting it up early is not that lever, but reaching month 13 with the raw material intact.
If you want to see your curve with your numbers — your chairs, your price per hour, your target occupancy — book a demo and we will calculate it with you.
Five questions to read your own curve
- Have you done the division? Target hours for month 12 ÷ hours per new patient = first visits per month you need. Without that number, the first-year plan is a wish.
- Does every first visit leave a complete record? Verified mobile, consent, treatment noted. Count last week's.
- Do you ask for the review on the day of the first visit? If the answer is "when we remember", your reputation grows at the spontaneous 1 % rate.
- Can someone who discovers you on a Sunday at 10 pm leave with a booked appointment? If not, you are closed 70 % of the week for growing too.
- Do you know which patients from your month 1 should come back in month 7? If your software cannot give you that list in a minute, month 13 will arrive empty.
The first-year figure that matters is not in any report: it is the result of a division only you can do, and of three deposits that start filling the day you open, or never do.

Ready to try Keishal in your dental clinic?
Book a demo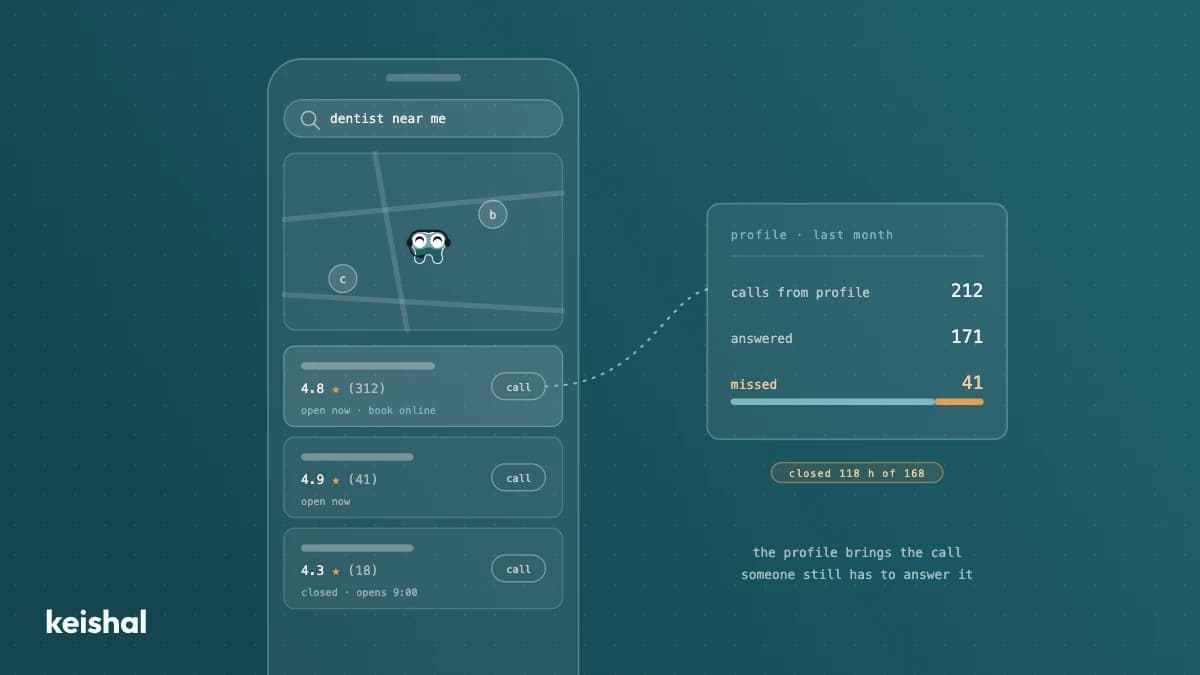
Google Business Profile for dental clinics: how to optimize it and what it will not fix
Your Google Business Profile is your dental clinic's real front page: many patients decide and call from there without ever visiting your website. Tuning it up is one afternoon of work and needs no agency: the right category and services, real hours including holidays, your own photos, a booking link and a constant flow of reviews. What the profile won't fix is what happens to the contacts it generates: with 50 open hours out of the week's 168, 118 go uncovered (70%). If the call lands there, the profile has only optimised your volume of missed calls.
Appointment reminders for your dental clinic: SMS, WhatsApp or phone call
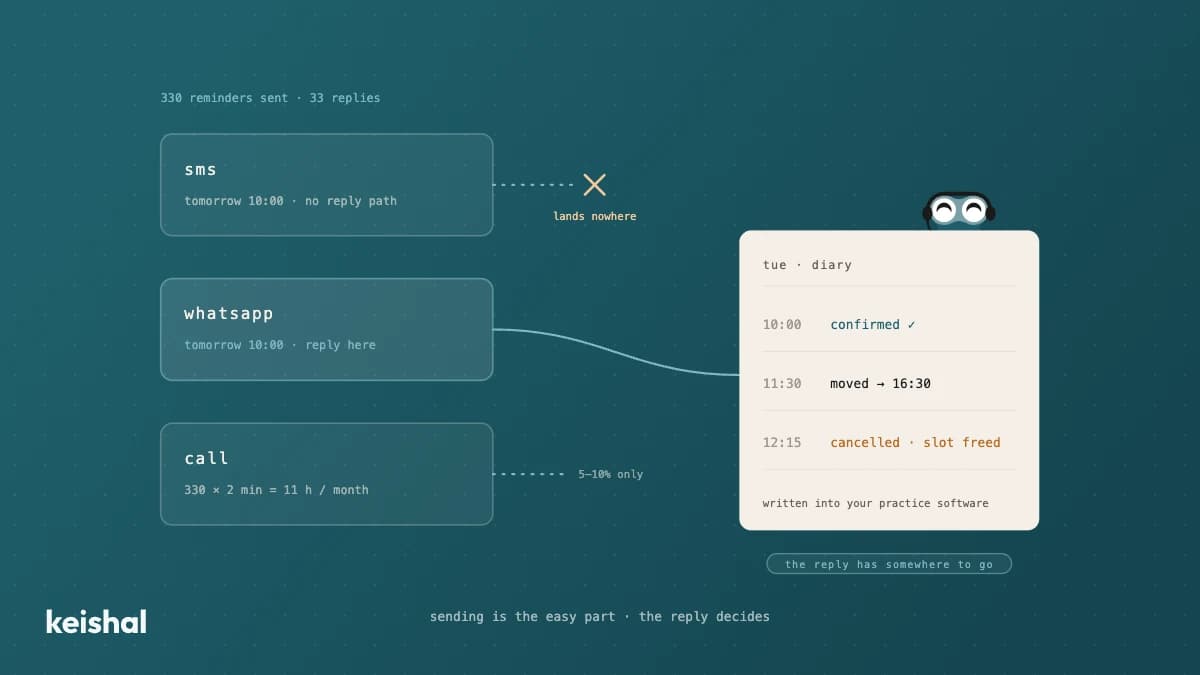
A diary with 15 appointments a day across 22 working days generates 330 reminders a month. If one patient in ten replies, that's 33 conversations someone has to handle: confirmations, reschedules, cancellations that open a slot. That's why the channel matters less than the reply: SMS notifies but rarely listens, WhatsApp resolves things in the same thread, and the phone call is for the cases that need it. In 2026, the real purchase decision isn't "which channel do I buy?" but "who handles what patients reply?".