
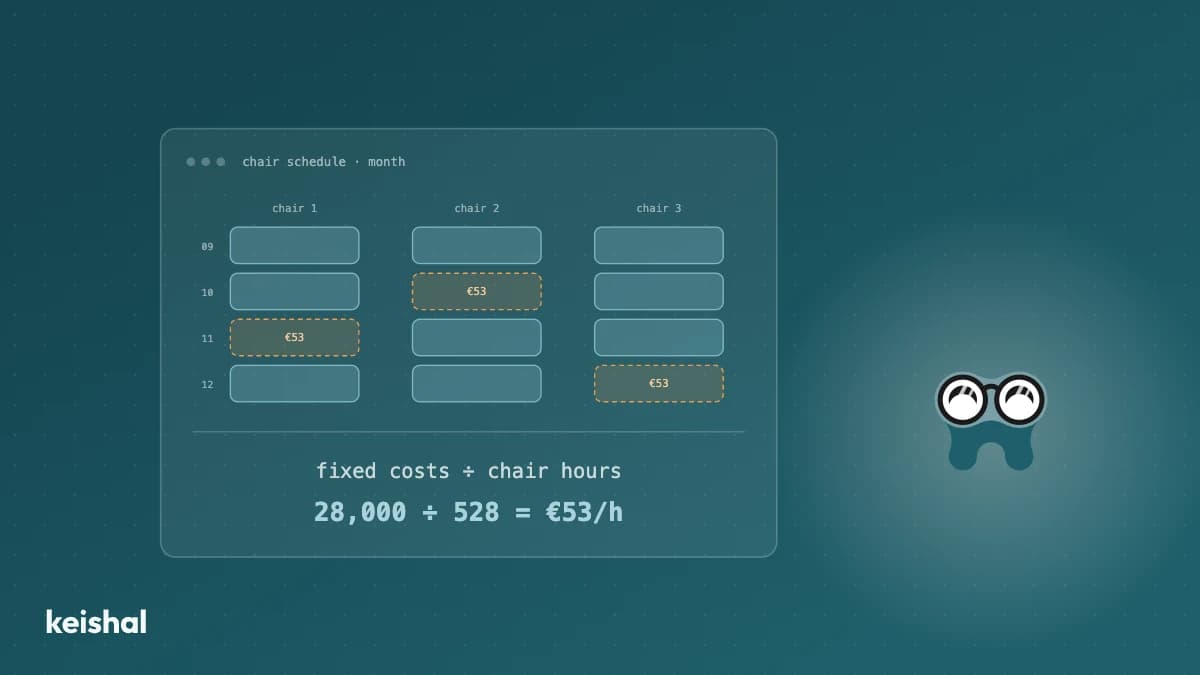
Billing more doesn't mean earning more. Dental clinic profitability comes down to a number almost nobody calculates: fixed cost per chair hour (monthly fixed costs ÷ available chair hours). With €28,000 of fixed costs and 528 hours a month, each hour costs about €53, occupied or not. That number turns schedule gaps and no-shows into concrete costs, and tells you what occupancy you need to cover your costs. Here's the calculation, step by step.
A clinic can bill €40,000 a month and earn less than another that bills €30,000. Revenue is the number everyone watches, but it doesn't answer the question that matters: is there money left after paying everything it costs to open every day?
To measure your dental clinic's profitability you don't need an audit. You need a number almost no clinic calculates: your fixed cost per chair hour. In this guide we work it out step by step, with your own figures and arithmetic you can check.
Billing is not earning
"We bill more than ever, but I couldn't tell you whether we earn more." That's a composite sentence, built from real conversations with clinic owners. We hear it, in one form or another, all the time.
There's a simple explanation. Revenue rises when you do more treatments, but costs rise with it: more materials, more lab hours, more of the team in motion. And meanwhile fixed costs run on their own, whatever you bill.
The result is a very common feeling in 2026: clinics full of activity that don't know whether that activity leaves a margin. Profitability doesn't show up in the bank account at month end, because late collections, early payments and one-off investments all blur together there.
It shows up in a much simpler relationship: what each chair hour costs, and what each occupied hour leaves behind.
The missing number: your fixed cost per chair hour
The calculation takes three steps, and you can do it today with information you already have.
Step 1: add up your monthly fixed costs as a single block. Rent, total team payroll, social security, insurance, software, maintenance, accounting, subscriptions and recurring marketing. No need to break it down further: what matters is the total you pay even if not a single patient walks in.
Step 2: work out your available chair hours. Multiply operational chairs by opening hours by working days. A clinic with 3 chairs, 8 hours a day and 22 days a month has 3 × 8 × 22 = 528 available chair hours.
Step 3: divide. If your fixed costs are €28,000 a month: 28,000 ÷ 528 ≈ €53 per chair hour.
That's the number. Every chair hour at that clinic costs about €53, occupied or empty. The cost is already paid; the only variable is whether that hour produces anything.
With your figures the result will be different, and that's exactly the point: it's your number, calculated on your structure, not a sector average of unknown origin.
What that number makes visible
With the cost per hour in front of you, things that felt abstract become concrete figures.
Schedule gaps. If your real occupancy is 70%, the remaining 30% is empty hours: 528 × 0.30 ≈ 158 hours a month. At €53 an hour, that's around €8,400 a month of fixed costs consumed by empty chairs. And it's not so much income you missed as cost you already paid that produced nothing.
No-shows. A patient who doesn't turn up to a 45-minute appointment consumes about €40 of fixed cost (0.75 × €53), on top of the treatment that goes undone. At 20 no-shows a month that's 15 hours: around €800 of fixed cost lost, month after month. That's why reducing no-shows at your clinic is a direct profitability lever, not just a scheduling nuisance.
Longer opening hours. Before adding hours or another chair, this number tells you how much fixed cost each new hour adds and how much extra occupancy you need for it to pay off.
The threshold: how much occupancy covers your costs
The second calculation connects what an hour costs with what an hour leaves.
Take your average billing per occupied hour. In our example, €120. Subtract the variable cost of producing that hour (materials and lab; say 30%, which is €36). That leaves €84 of margin per occupied hour.
Now divide your fixed costs by that margin: 28,000 ÷ 84 ≈ 333 hours. That clinic needs 333 occupied hours a month to cover its costs: 63% of its 528 available hours (333 ÷ 528 ≈ 0.63).
Below that occupancy, the month closes at a loss even though the clinic is busy and billing. Above it, every additional occupied hour contributes margin. With your numbers the threshold will be different; what matters is knowing it.
That threshold explains why two clinics with the same revenue live opposite realities. The one holding 85% occupancy on a contained structure makes money. The one billing the same with double the fixed costs may be losing it without knowing.
With more than one clinic, that same comparison becomes the management tool: profitability per location, with percentages calculated the same way in all of them, never with total billing. How to do it is in how to manage multiple dental clinics and compare locations.
If working out your threshold leaves you wondering how much you should be billing, that calculation has its own guide: how much a dental clinic makes, worked out as your own structure's ceiling rather than a sector average.
The third lever: treatment that stalled halfway
Occupancy and margin measure what happens inside the schedule. The third lever sits outside it: patients with an accepted treatment plan who never started, or stopped halfway.
The calculation is just as visible. Count the accepted, unstarted treatment plans from the last 12 months in your PMS and add up their value. With 40 plans averaging €650, there's €26,000 of already-accepted treatment waiting in your database.
Not all of it will come back: some patients have moved, some solved it elsewhere, some no longer need it. But it's demand that already existed, with the expensive part (winning the patient and getting to yes) already done. Filling schedule gaps with that demand costs far less than generating new demand from scratch, which is why it moves the margin faster.
How to keep an eye on profitability every month without an audit
You don't need a forty-metric dashboard. Three numbers a month give you the pulse:
- Real occupancy: occupied hours ÷ available hours.
- Fixed cost per chair hour: recalculate it when your structure changes.
- Margin per occupied hour: average billing per hour minus variable cost.
They're close cousins of the monthly dental clinic KPIs we've covered in detail: if you already track those four, these three fall out almost by themselves.
One practical warning: these numbers are only worth what your schedule is worth. If appointments aren't recorded properly, or there are duplicates and missing fields, the occupancy you calculate will be fiction. Data quality at your clinic holds this calculation up, the same way it holds everything else up.
From snapshot to forecast
Cost per hour tells you whether last month was profitable. The next step is looking forward: with next month's confirmed schedule and your margin per hour, you can estimate whether the month will cover costs before living it.
That calculation, with a full worked example, is in our guide to revenue forecasting for dental clinics. The logic is the same as here: arithmetic with your numbers, not promises.
The difference is how you keep it alive. Done by hand, it's an afternoon's exercise once a month; automated, it's a panel that updates itself. That's what Keishal's analytics and revenue forecasting do: the same numbers, calculated continuously on your real activity.
Does this work with your current software?
Everything this calculation needs already lives in your PMS: appointments, gaps, treatment plans, billing. It doesn't matter whether you run Gesden, Nubimed, Dentalink, Clinic Cloud or anything else: there's no software to change and nothing to migrate.
You can do the maths by hand once a month by exporting the schedule. And if you'd rather not do it yourself, Keishal is an autonomous system that connects to your current PMS, operates the administrative side (reminders, reactivation, schedule occupancy) and hands you these numbers already calculated, with nothing for your team to operate.
What this calculation can't tell you
It's worth being honest about the limits, because they're what make the rest reliable.
This calculation is an operational compass, not accounting. It doesn't replace your advisors: depreciation, tax, financing or the decision to open a second operatory are conversations to have with whoever manages your fiscal numbers.
Nor does it tell you what prices to set or which treatments to prioritise. It tells you something prior, and more useful day to day: whether the structure you pay for every month is producing or not, and where the margin leaks when it isn't.
And 100% occupancy is not a realistic target: there will always be gaps, emergencies and last-minute cancellations. The goal is for the distance between your real occupancy and your coverage threshold to be known margin, not mystery.
If you'd like to see these numbers calculated on your own clinic, without changing software and with nothing for your team to operate, book a demo. We'll show you what it looks like for a clinic your size.

Ready to try Keishal in your dental clinic?
Book a demo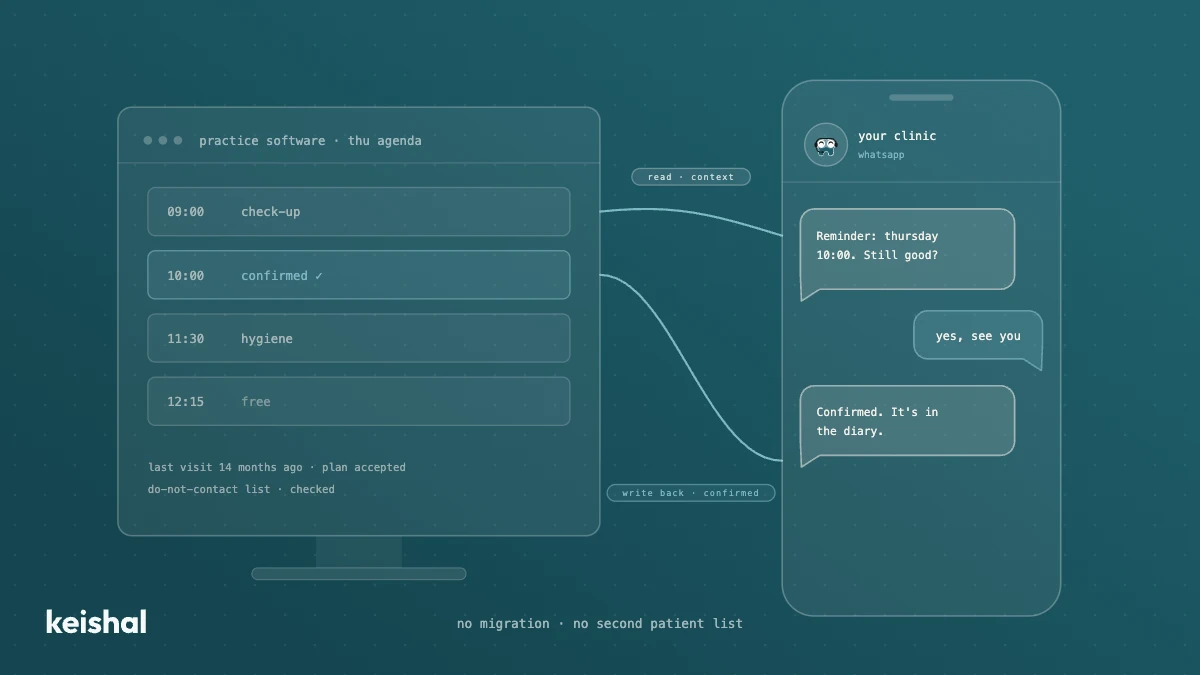
Integrating AI with your dental practice software: what a real connection means
A real integration with your dental clinic's software does two jobs: it reads your patients' data for context and writes appointments, confirmations and status changes back into your program. A monthly CSV, a calendar connector or a read-only tool leaves the rest to your team: with 330 reminders a month, marking each confirmation at 30 seconds adds up to almost 3 hours. Ask for the list of supported programs and versions in writing, and check that there's no migration and no duplicate patient base.
Switching dental software: what migrating really involves and when you don't need to
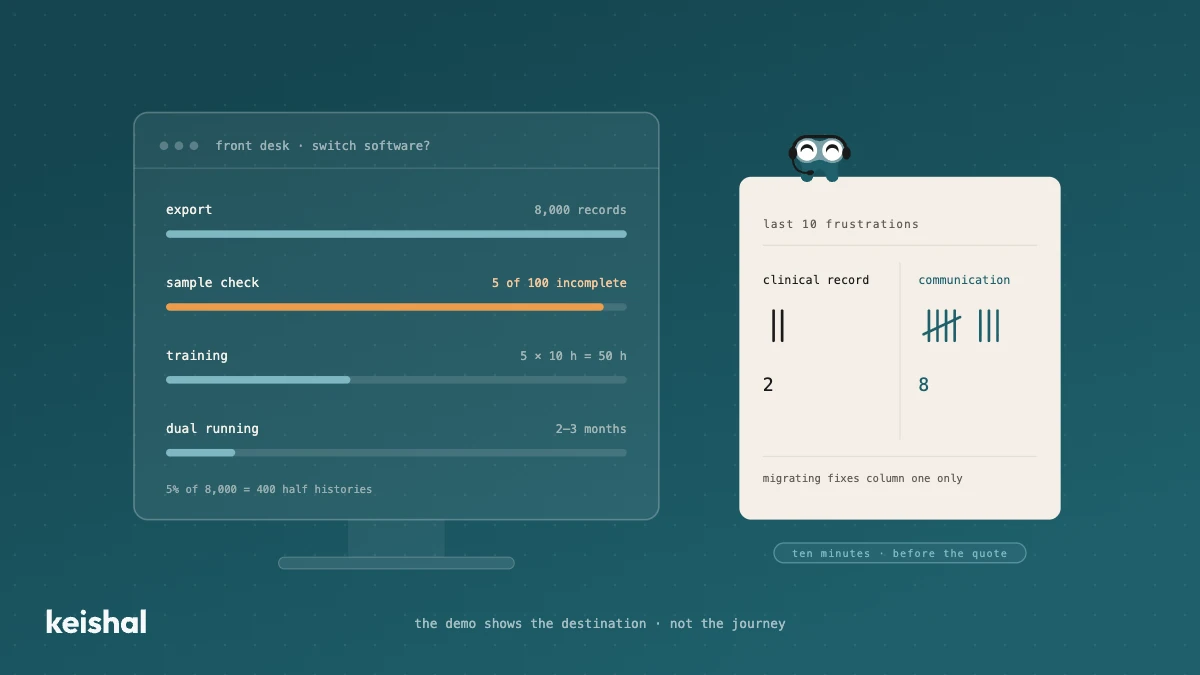
Switching dental software isn't installing a program: it's exporting and verifying thousands of records, training the team (5 people × 10 hours = 50 hours) and running two systems side by side for two or three months. It's worth it when the software has no support, holds your data hostage or the clinic has outgrown it. But if what's pushing you is unmanaged reminders, recall that never happens and out-of-hours messages, that communication layer can be added on top of your current PMS, without migrating anything.