
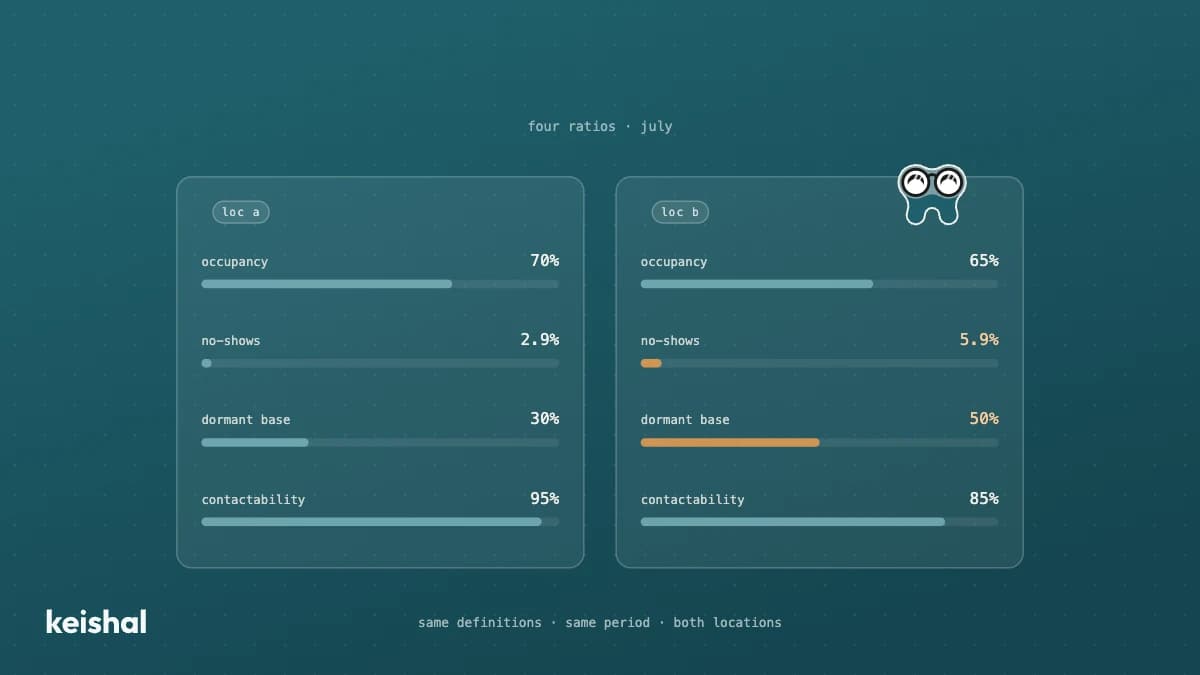
When you go from one clinic to two or three, the bottleneck stops being the schedule and becomes visibility: the location where you are not is a black box. To manage it without being there, compare locations with four ratios computed the same way everywhere — occupancy (370 out of 528 hours = 70%), no-shows over total appointments, dormant base over total database and contactability — and distrust any comparison made with unequal data quality. Total revenue compares sizes; ratios compare management.
To manage multiple dental clinics is a different job from managing one, and almost nobody talks about it. This article is for the owner of two, three or five locations. Not for large chains with professional management at every one, but for the dentist who opened a second clinic and discovered that the problem is no longer filling the schedule: it is knowing what is happening at the location where they are not today.
With one clinic, visibility is free. You walk past reception, hear the phone, glance at the day's schedule and know how the month is going. With two or three, that direct information disappears for half of the week, and the usual answer — driving more, calling more, asking "how is everything" over WhatsApp — does not scale.
"I have two clinics and I spend the week driving between them. The one I don't set foot in that week is a black box." It is a pattern we hear repeatedly in conversations with owners of small groups in 2026 (the sentence is a composite of several real conversations, not a literal quote).
The solution is not being everywhere, but making the locations comparable with the same numbers. This article gives you the four indicators to do it, and the trap that makes many comparisons between locations go wrong.
What changes when you manage multiple dental clinics
With a single clinic, monthly indicators are useful, but direct observation covers a good part of the job. We already wrote what to track every month at one clinic; if you have one location, start there.
With several locations, two things change.
The first is simple arithmetic. A week has five working days. With two locations, each one sees you two or three days; with three, one or two. Most of what happens at each clinic happens without you in front of it.
The second is more subtle: comparison appears. For the first time you have two operations doing the same job, and the question stops being "are we doing well?" and becomes "why does location B convert worse than A?". That question is uncomfortable, but it is also the biggest advantage of running several locations: each clinic is the other's control group. Used well, it tells you which process to copy and which to fix.
The bottleneck, in short, stops being the schedule and becomes visibility.
The typical mistake: comparing locations by revenue
The first comparison everyone makes is each location's total billing. It is also the least useful one.
Absolute revenue compares sizes, not management. A location with four chairs will almost always bill more than one with three; that says nothing about which one is better run. And a new location, with a small patient base, will always lose against the older one even if it operates better.
To compare management you need ratios: numbers relative to each location's capacity — per available hour, per appointment, per patient in the database. A ratio travels well between locations of different sizes; a total does not.
The four indicators for comparing locations
Four ratios are enough to start. All four are computed from data any practice management software (PMS) already records, and all four are expressed as percentages, so a three-chair location and a four-chair location can be compared fairly.
For the example we will use two locations. A, the original one: 3 chairs and 3,000 patients in the database. B, the newer one: 4 chairs and 2,800 patients.
1. Occupancy: occupied hours over available hours
Available chair hours per month: chairs × hours per day × opening days. Location A: 3 × 8 × 22 = 528 hours. Location B: 4 × 8 × 22 = 704 hours.
If A filled 370 hours and B filled 460, occupancy is 370 ÷ 528 = 70% against 460 ÷ 704 = 65%. B bills more — it has one more chair — but makes worse use of its structure. That nuance is invisible in total revenue, and it is exactly what occupancy reveals.
Every empty hour is fixed cost already paid: rent, payroll, equipment. How to translate those hours into euros with your own cost per chair hour is covered in dental clinic profitability.
2. No-shows: missed appointments over total appointments
Location A: 18 no-shows out of 620 appointments = 2.9%. Location B: 41 out of 690 = 5.9%.
In absolute terms, "18 versus 41" looks like a moderate problem. As a ratio, B doubles A — and one no-show in every 17 appointments is no longer bad luck: it is a process signal. Reminders that don't go out, confirmations nobody answers, gaps nobody refills. The comparison doesn't tell you the cause, but it tells you precisely where to ask.
3. Dormant base: inactive patients over total database
Count the patients with no visit in the last 12 months and divide by the total database. Location A: 900 out of 3,000 = 30%. Location B: 1,400 out of 2,800 = 50%.
Half of B's database is standing still. Multiply by your average treatment value and the number gets serious: 1,400 × €110 = €154,000 of pending treatment within reach of a reactivation campaign. Not all of them would come back — some moved away, others no longer need it — but the difference between 30% and 50% is not explained by people moving: it is explained by how each location works its recall.
4. Contactability: records with a valid mobile over total records
The indicator almost nobody checks, and the one that decides whether the other three can be trusted. Take 100 random patient records at each location and count how many have a mobile number that works. If 5 out of 100 fail at A and 15 fail at B, B's numbers are lying to you. The next section explains how.
The trap: comparing locations with unequal data quality
Let's continue the example. At location B, 15 out of every 100 records have no usable mobile: over 2,800 patients, that is 2,800 × 15% = 420 people out of reach of any campaign.
Now imagine you run the same reactivation campaign at both locations and compare results. B will come out worse even if its team does the job equally well, because part of its base never received the message. The easy conclusion — "reactivation doesn't work at B", or worse, "B's team doesn't work" — punishes the wrong location.
That is why contactability is measured first. Comparing locations with unequal data quality is not comparing management, but databases. How to audit and improve yours is covered in data quality at your dental clinic.
The practical rule: before drawing conclusions from any comparison between locations, level the data quality first. And if you can't level it yet, put each location's contactability next to the result, so you read it with that correction in front of you.
The same number, computed the same way everywhere
This is where small groups usually build a spreadsheet: each manager exports from the PMS in their own way, once a month, and someone puts it all together.
The problem is not volume — four ratios across two locations is eight numbers a month. The problem is definition. If at A "dormant" means 12 months without a visit and at B it means 18, or if one counts blocked chair hours as available and the other doesn't, the comparison is broken by design. And nobody notices, because the spreadsheet doesn't show its definitions: it only shows the result.
If you keep the manual system, write the definitions down once — what counts as an available hour, what a dormant patient is, what counts as a no-show, what a valid mobile is, over which period — and have every location export against that sheet.
An autonomous system like Keishal does this work without depending on anyone exporting anything: it operates on top of the PMS each clinic already uses, computes the same indicators the same way at every location and turns them into a monthly report built for the owner. The comparison stops being a project and becomes an email that arrives on its own.
And one limit worth saying out loud: a dashboard doesn't fix a location. It tells you where to look. The conversation with B's team about how they confirm appointments is still yours to have; the difference is that you arrive at it with the number in front of you, not with a feeling.
How to start this week
- Write the definitions. The four ratios, in writing: what an available hour is, what a dormant patient is (12 months is a reasonable cutoff), what counts as a no-show, what a valid mobile is.
- Compute them over the last closed month, the same period for every location. Not over "the month so far": partial periods favour whichever location had the better week.
- Compare and mark the biggest deviation, not the worst number. If every location has 30% of its base dormant, you have a group issue, not a location issue.
- Visit the deviating location with the number in front of you. Ask about the process ("how do you confirm appointments?"), not the result ("why do you have so many no-shows?"). The second question puts the team on the defensive; the first one gets them explaining.
When a location stands out at something, the move is the same in reverse: understand its process and copy it to the others. Running several locations means running a live experiment in parallel, and few owners take advantage of it.
Once the four ratios have been stable for a few months, the next step is looking forward: forecasting what each location will bill next month with the same data.
For the owner of two to five locations
Everything above is written for small groups: the owner who still sees patients, knows the teams by name and has no operations director. Large chains play a different sport, with different tools.
At this scale, visibility across locations doesn't need a department. It needs four reliable numbers a month, computed the same way everywhere, and someone — you — acting on the biggest deviation. If you want to see how Keishal produces those numbers operating on top of the PMS each of your locations already uses, book a demo and we will show you with your own case.

Ready to try Keishal in your dental clinic?
Book a demo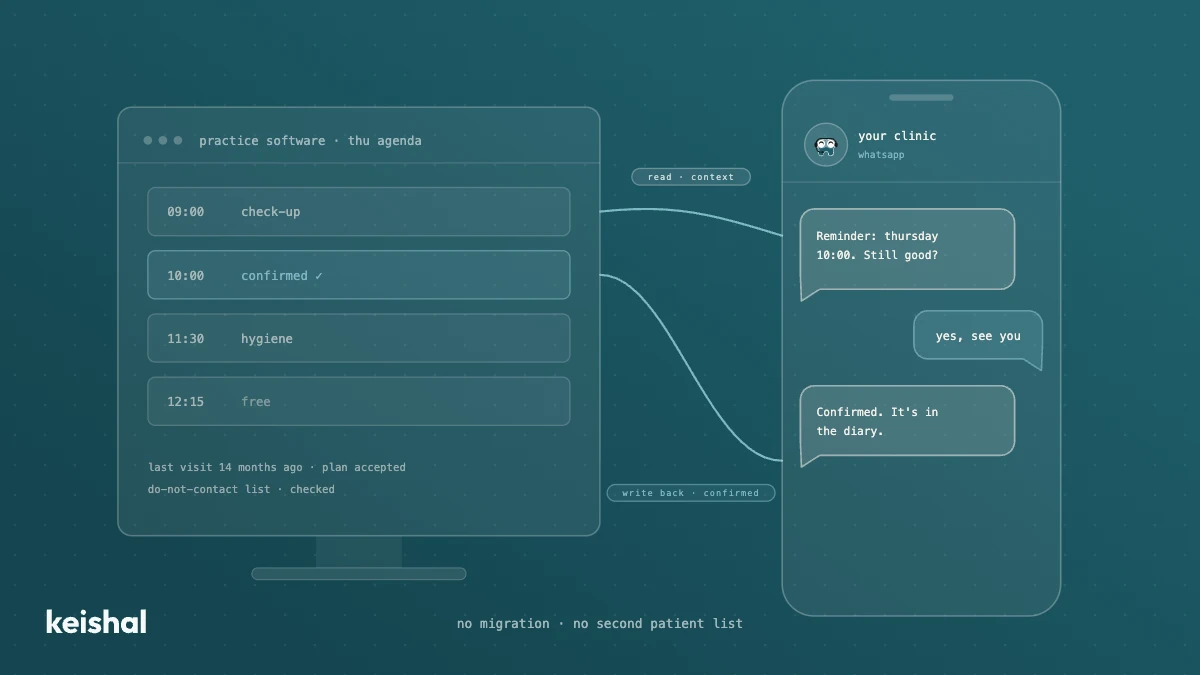
Integrating AI with your dental practice software: what a real connection means
A real integration with your dental clinic's software does two jobs: it reads your patients' data for context and writes appointments, confirmations and status changes back into your program. A monthly CSV, a calendar connector or a read-only tool leaves the rest to your team: with 330 reminders a month, marking each confirmation at 30 seconds adds up to almost 3 hours. Ask for the list of supported programs and versions in writing, and check that there's no migration and no duplicate patient base.
Switching dental software: what migrating really involves and when you don't need to
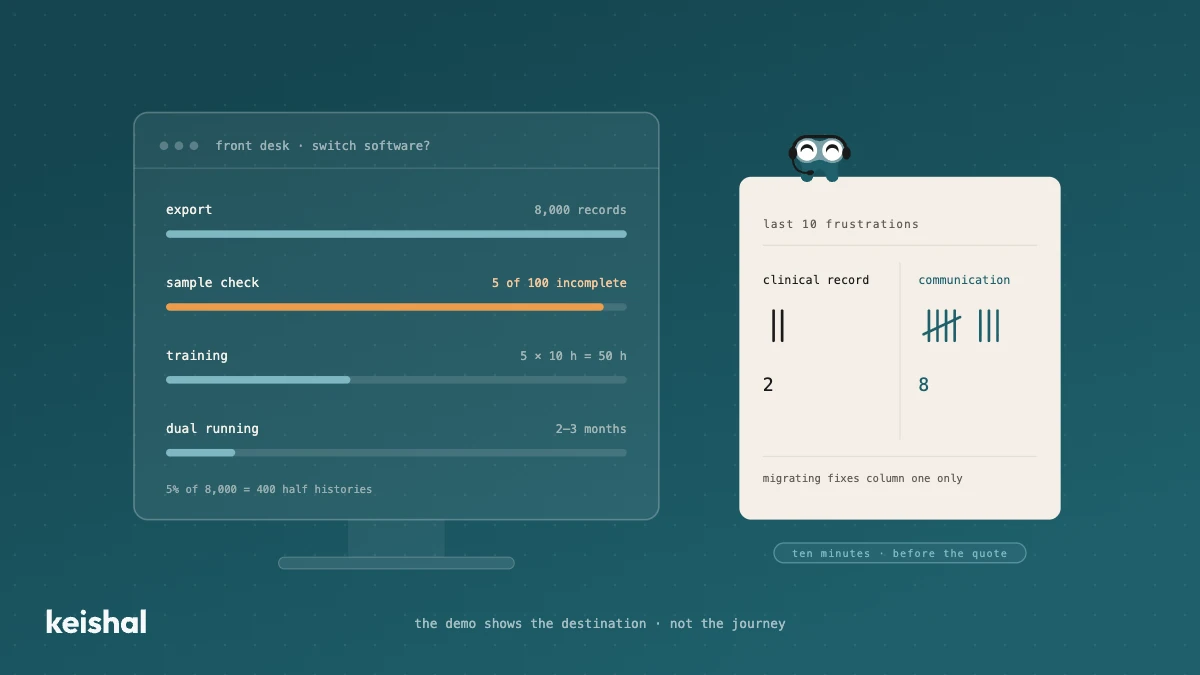
Switching dental software isn't installing a program: it's exporting and verifying thousands of records, training the team (5 people × 10 hours = 50 hours) and running two systems side by side for two or three months. It's worth it when the software has no support, holds your data hostage or the clinic has outgrown it. But if what's pushing you is unmanaged reminders, recall that never happens and out-of-hours messages, that communication layer can be added on top of your current PMS, without migrating anything.