
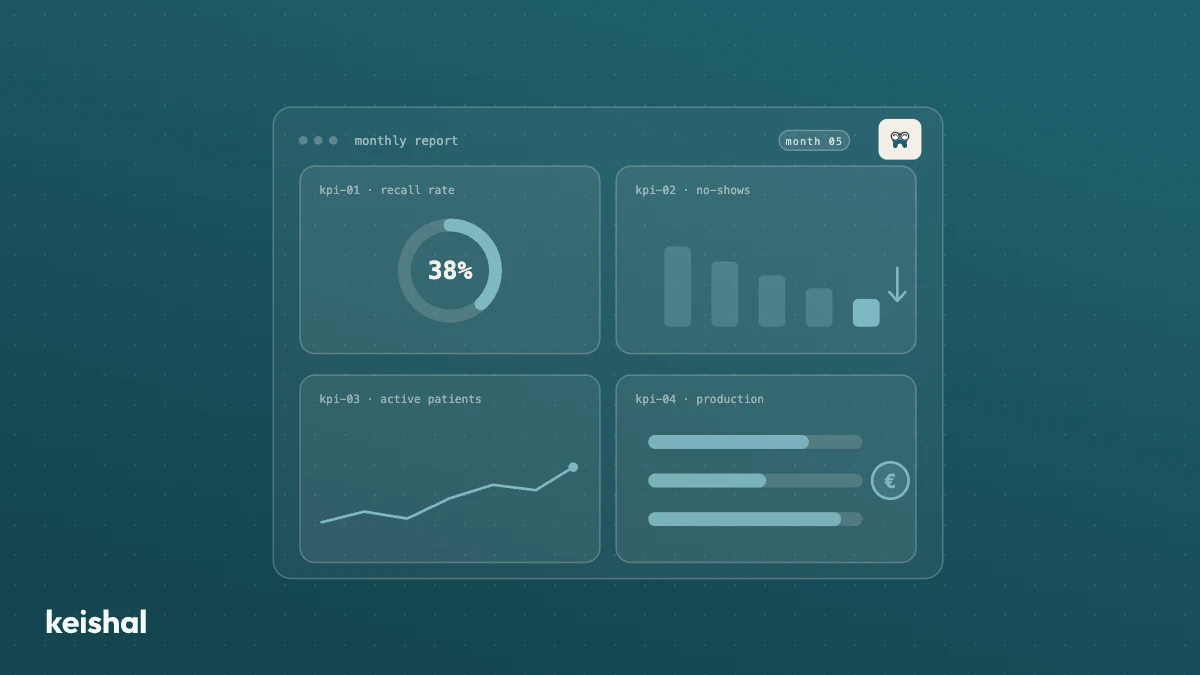
An autonomous system generates dozens of reactivation, recall, and booking conversations every week. If nobody turns them into a number, that activity stays invisible. The four KPIs worth checking every month are: dormant database coverage, contact-to-booking conversion, off-hours bookings, and contact data quality. Each one is calculated with your own clinic's arithmetic, not external promises.
An autonomous system that reactivates patients, confirms appointments, and manages bookings over WhatsApp generates constant activity. The problem isn't a lack of work. The problem is that almost no clinic turns that activity into a KPI it reviews every month.
Reactivation, recall, and bookings are the part of the administrative work a system like Keishal already makes visible, conversation by conversation. What's missing at most clinics is the next step: rolling those conversations up into a handful of figures the owner checks once a month, figures that say whether the business is doing well or not.
Why activity isn't the same as visibility
A front desk that answers WhatsApp, confirms appointments, and manages the waiting list is busy all day. But being busy isn't the same as being visible. If nobody adds up how many dormant patients came back this month, how many bookings arrived outside opening hours, or what share of the database has a valid phone number, those figures still exist. Nobody is just looking at them.
That's the difference between the three blocks of a dental clinic's administrative work. The daily communication block and the reactivation block generate the activity: reminders, bookings, recall messages. The third block, business visibility, is what turns that activity into something you can manage instead of guess at.
It's a problem that mostly shows up at clinics that already have the first two blocks solved. Once reactivation and daily communication run on their own, the question stops being "who's doing this?" and becomes "is it working?". Without numbers, that question has no reliable answer, and it tends to get answered by gut feeling instead: a good week sticks in memory, a quiet one gets blamed on the season, and neither gets checked against what actually happened in the database.
Here are the four KPIs worth reviewing every month, with the arithmetic to calculate each one from your own clinic.
1. Dormant database coverage
This is the starting point: how much demand is sitting idle inside your own patient database.
Count how many patients haven't had a visit in over twelve months and divide by your total active patients. If you have 3,000 active patients and 900 haven't returned in over a year, your dormant coverage is 900 divided by 3,000, or 30%.
That 30% doesn't mean everyone will come back. Some have moved away, others no longer need treatment, others have switched clinics. But it's the number that sets the real size of the opportunity before you try anything. Without this figure, any reactivation campaign runs blind: you don't know if you're working 10% of your dormant base or 90% of it.
If the percentage climbs month over month, that's not just a marketing data point. It's a sign that recall isn't working at the front door: patients who should have come back before the twelve-month mark, and didn't.
2. Contact-to-booking conversion
Once you know how many dormant patients you have, the next number is how many of the ones you contact this month end up booking.
If 250 dormant patients were contacted this month and 18 booked an appointment, your reactivation conversion is 18 divided by 250, or 7.2%. Track that number month by month. There's no single "right" figure that applies to every clinic: it depends on how old the database is, what treatment is pending, and the time of year. What matters is the trend inside your own clinic, not comparing yourself to another one.
A month with a lower-than-usual conversion doesn't always mean something is broken. Sometimes the database itself has thinned out: the patients most likely to return already have, and what's left costs more to convert. That's why it's worth watching the trend across several months rather than any single one.
3. Off-hours bookings
This KPI measures a different kind of demand: the kind that already exists today, but gets lost because it arrives outside front-desk hours.
Count how many bookings arrived this week between closing time and opening time, and divide by total bookings for the week. If 12 out of 50 total bookings arrived between 8pm and 9am, that 24% is agenda space that used to be lost, or recovered the next day with a callback that didn't always land in time.
When a patient can book on their own from WhatsApp, choosing their own slot on a calendar, that percentage stops being a leak and becomes a number you review every month like any other.
4. Contact data quality
This last KPI is the least visible of the four, and the one that everything else rests on.
Review a sample of your patient database: how many records have an invalid phone number, an empty email, or are duplicated. If 450 out of 3,000 records have some kind of contact problem, that 15% is the part of your database that no campaign, however well designed, can reach.
A database with 15% broken contacts doesn't just cut reactivation. It cuts appointment reminders, review requests, and any message that depends on a correct phone number or email, by the same proportion. It's the KPI that multiplies or caps every other one.
If you can only track one, track this first
Of the four, data quality is the one most often skipped, and the one that should matter most. It's tempting to look at reactivation conversion first, because it feels like the "results" number. But a 7% conversion rate on a database with 15% broken contacts is actually higher than it looks: clean up that 15% and the room for improvement is there before you even touch the message or the offer.
It's an uncomfortable metric because it has no quick, one-month fix. Cleaning up 3,000 records by hand is weeks of work that almost no clinic ever gets around to, so the problem builds up quietly. That's exactly why it's the KPI most worth automating before the others.
It's the first thing we check with any clinic that starts taking these numbers seriously: there's almost always more hidden headroom in the contact data than in the reactivation message itself.
From four separate KPIs to a monthly report
The four KPIs above can be calculated by hand, month after month, with a spreadsheet and patience. Results analytics does the same thing automatically: it connects to the conversations and appointments the system already manages and delivers these numbers in a monthly report, without anyone exporting anything from the PMS.
The next step is looking forward, not just backward. Revenue forecasting takes that same historical activity and projects it: how many appointments and what occupancy the clinic can expect next quarter if the current trend holds. It doesn't replace the owner's judgment, but it gives a starting point built on numbers instead of intuition.
And the data quality KPI stops being a one-off manual review: continuous database quality improvement detects duplicates and incomplete contacts on an ongoing basis, so the 15% of broken records from the example above doesn't quietly grow back.
All three run on top of the PMS the clinic already uses. There's no migration and no new dashboard to learn: the data comes from the same system the team already works in for reactivation and daily communication.
Who should be looking at each number
Not all of these KPIs matter to the same person, or with the same urgency. The owner usually wants the big picture once a month: dormant coverage, conversion, and revenue forecast. Those are the numbers that answer "how's the business doing?" without getting into day-to-day operations.
To read that picture in context, it helps to know how much a dental clinic makes with a structure like yours: the ceiling to compare against what these numbers move month after month.
Clinic management, where that role exists, needs to check off-hours bookings and data quality more often, because those are the ones that shape the daily work: an agenda that fills itself or a gap that needs covering by hand, records that need reviewing before a campaign goes out. Splitting the review this way keeps it from all landing on one person once a month, which is how most of these numbers end up never getting checked at all.
What if my PMS doesn't produce these reports?
Most dental practice management software shows the day's schedule and each patient's history, but doesn't cross-reference that data to produce a monthly figure. That's why this calculation usually stays in the owner's head instead of in a report.
A system that already operates reactivation, reminders, and bookings has this data by default, because it's what the work itself generates. There's no need to switch PMS or learn one more dashboard: the report is built on the same conversations that are already happening.
How often to check each number
Not every KPI needs the same frequency. Off-hours bookings and reactivation conversion are worth checking weekly, since they change the fastest. Dormant coverage and data quality move more slowly, so a monthly review is enough.
What matters isn't the exact frequency, but having a fixed slot on the calendar for it. A KPI that only gets checked when something's already wrong stops being a management indicator and becomes an alarm that arrives too late.
And if you run more than one clinic, these four numbers are also the basis for comparing locations: the comparison only works with ratios calculated the same way everywhere, not with total billing. The full method is in how to manage multiple dental clinics with the same KPIs.
If you want to see these four numbers applied to your own clinic's real data in 2026, you can book a demo.

Ready to try Keishal in your dental clinic?
Book a demo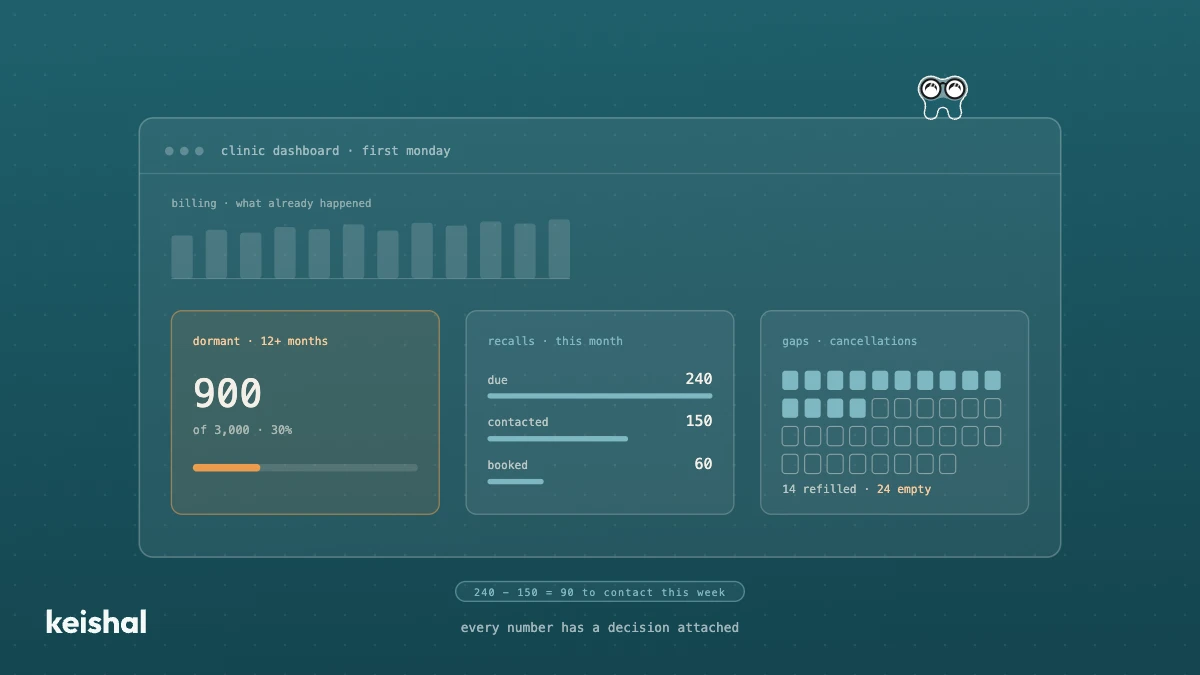
Dental clinic dashboard: what it should actually show you
A dental clinic dashboard is useful if it helps you decide something. The one in your practice management software usually shows billing and the schedule, which is the past. What it usually lacks is the patient base: how many haven't been in for over a year (900 of 3,000 = 30%), which recalls fall due this month, which gaps stayed empty and how much of your base you can actually reach. Six questions, each with its number and its decision.
What is superintelligence and what AI actually does in a dental clinic today
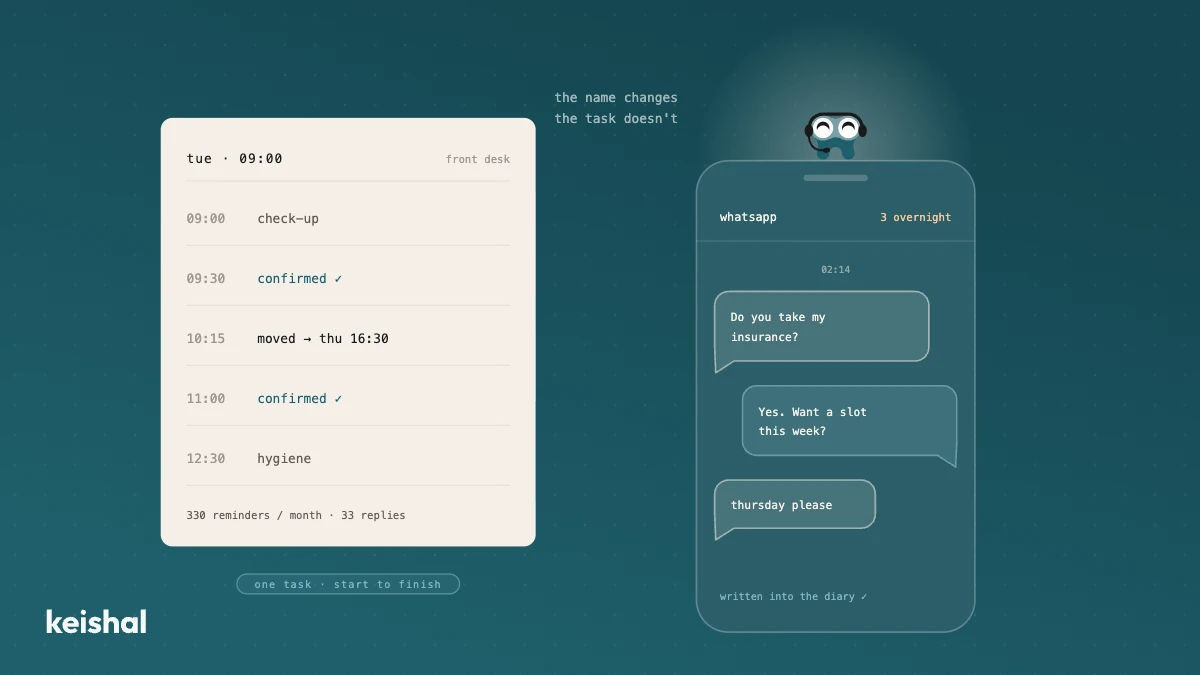
Superintelligence is a hypothetical AI that would outperform people at almost every intellectual task, and it doesn't exist today. The AI dental clinics use is narrow AI: it confirms appointments (15 × 22 = 330 reminders a month), reactivates dormant patients, answers during the 118 hours a week the clinic is closed and flags incomplete records. For a clinic, the name matters less than the specific task the tool gets done in your schedule.