
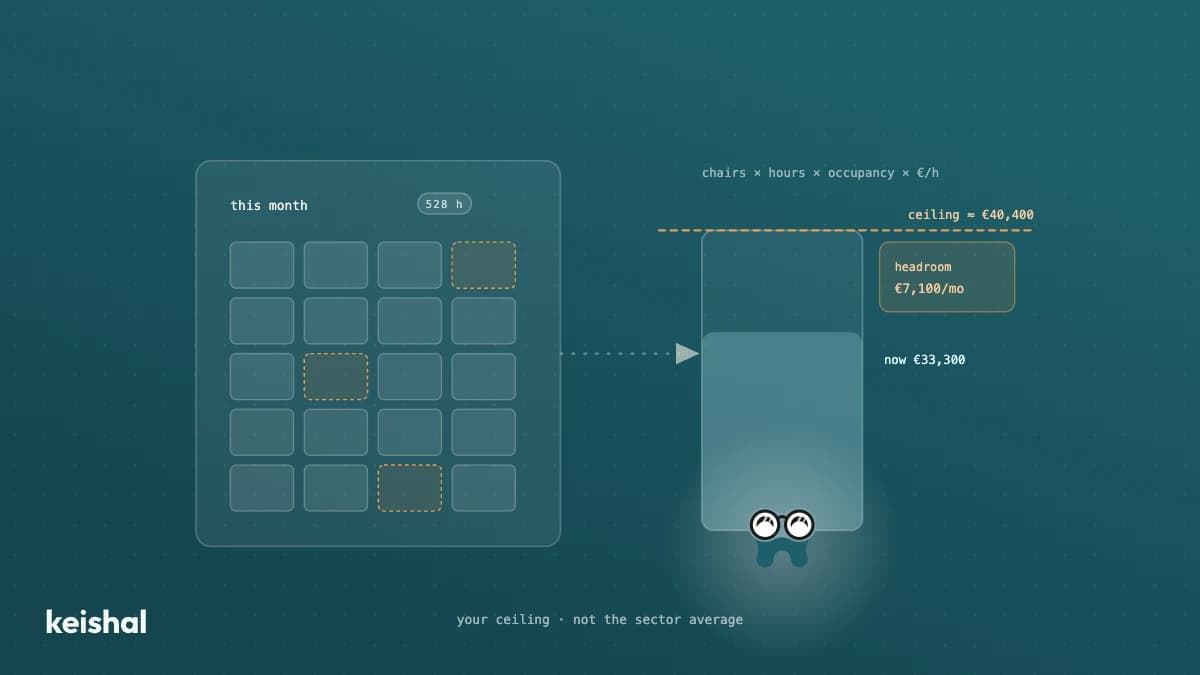
No published average tells you how much your clinic should make: they mix single-chair practices with chains and almost never cite a source. The useful number is your revenue ceiling, and it comes from your own structure: chairs × available hours × realistic occupancy × revenue per occupied hour. With 3 chairs, 528 available hours and 70% occupancy, moving to a realistic 85% is about 79 hours a month you already pay for that currently bill nothing.
If you're searching for how much a dental clinic makes, you probably don't want a statistic. You want to know whether your clinic is where it should be. It's a comparison question, which is why the usual answer (a national average) is so frustrating: it compares you with clinics that look nothing like yours.
This article does something different. First it explains why no published average helps you decide anything. Then it calculates the number that does: your clinic's revenue ceiling, from your own numbers, with all the arithmetic visible.
Why the average tells you nothing
Search for "average dental clinic revenue" and you'll find figures that differ wildly from one another, often with no source and no methodology. In 2026 there are still averages in circulation that contradict each other, and there are three underlying reasons:
They mix structures that don't resemble each other. A single-chair practice run by its owner and a six-chair clinic with three dentists bill amounts that have nothing in common. An average that lumps them together describes neither.
They mix business models. Independent clinic, franchise, insurance-heavy practice: each model has different ticket sizes and volumes. The average flattens them.
They almost never cite a source. Most published figures don't say what sample they come from, what year they refer to or how they were calculated. We won't publish another average here, because we don't have one we could defend if you asked where it comes from.
And even if the figure were exact, it still wouldn't tell you what to do. If you're above it, you relax without knowing whether your structure could do far more. If you're below it, you worry without knowing which lever to pull. Your clinic's revenue isn't determined by the sector average; it's determined by your structure: chairs, hours, occupancy and what each occupied hour bills.
"Is what we bill normal? I have nothing to compare it against." — a summary of several 2026 sales conversations with clinic owners. It isn't a verbatim quote from one person, but it's the question that comes up most often.
The useful comparison isn't against other clinics, but against your own ceiling.
The calculation that does help: your revenue ceiling
Your revenue ceiling is the most your current structure can bill in a month. It comes from four numbers you already have:
- Chairs: how many treatment rooms can see patients at the same time.
- Available hours per chair per month: opening hours × working days.
- Occupancy: the percentage of those hours with a patient in the chair.
- Revenue per occupied hour: a normal month's revenue divided by that month's occupied hours.
The formula: ceiling = chairs × available hours × realistic occupancy × revenue per occupied hour.
A worked example with round numbers (swap in your own):
- 3 chairs open 8 hours a day, 22 working days: 8 × 22 = 176 hours per chair, and 3 × 176 = 528 available hours a month.
- At a current occupancy of 70%: 528 × 0.70 ≈ 370 occupied hours.
- If your revenue per occupied hour is €90: 370 × €90 = €33,300 billed per month.
- At a realistic occupancy of 85%: 528 × 0.85 ≈ 449 hours, and 449 × €90 ≈ €40,400.
The gap between what you bill and your ceiling: 449 − 370 = 79 hours a month you already pay for (rent, equipment, payroll) that currently bill nothing. At €90 an hour, 79 × €90 ≈ €7,100 a month of headroom without adding a chair, extending hours or raising prices.
As a table, so you can fill in your own column:
| Factor | Example | Your clinic |
|---|---|---|
| Chairs | 3 | |
| Available hours per month | 528 | |
| Current occupancy | 70% (370 h) | |
| Revenue per occupied hour | €90 | |
| Current revenue | €33,300 | |
| Ceiling (85% occupancy) | ≈ €40,400 | |
| Headroom | ≈ €7,100/month |
If you've never calculated your revenue per occupied hour, you don't need any new system: take last month's revenue and divide it by the hours your schedule shows as occupied that month. It won't be a perfect number, but it's good enough to place you.
Two honest limits to this calculation. First: 100% occupancy is not a realistic target. There will always be gaps from emergencies, last-minute cancellations and dead time between treatments; that's why the example uses 85% rather than 100%. Second: the ceiling isn't a revenue promise either. It measures how much fits in your structure, not how much will come in. What it does do is turn "are we billing well?" into a question with an answer: how far are we from our ceiling, and which factor is holding us back?
What moves each factor
Available hours: the expensive lever
Adding a chair or extending opening hours raises the ceiling, but it demands investment and higher fixed costs. It's the last lever worth pulling, not the first. Before you grow the structure, check how much headroom is left in the other two.
Occupancy: the cheap lever
Schedule gaps don't appear out of bad luck: they have concrete, countable causes. Late cancellations nobody refills, recall that should be booked but stays in the patient file, demand that arrives out of hours and never gets captured. Before accepting your current occupancy as normal, run a one-week gap audit to find out where the gaps come from.
There's one more cause almost nobody counts, because it happens while the clinic is closed. If you're open around 50 hours a week, nobody answers during the other 118 of the week's 168 hours (70%). Some of the patients who write or call in those hours end up booking wherever someone does reply, and that gap never even appears in your schedule: it's lost before it exists.
The other half of occupancy sits in your database. Count the patients who haven't visited in 12+ months: every one who comes back is occupied hours that are empty today. The step-by-step method is in how to reactivate inactive patients.
Revenue per occupied hour: the fine-tuning lever
It depends on your treatment mix and, above all, on how much already-accepted treatment never gets scheduled. Raising this number doesn't mean raising prices: it means what the patient has already said yes to actually lands in the schedule.
And measure it monthly, not once
You calculate the ceiling once; you watch the distance to it every month. Occupancy, gaps and revenue per hour belong in the same monthly view as the KPIs worth tracking every month. And when you want to look forward instead of backwards, the same reasoning works to estimate what you'll bill next month.
Three ways to misuse this calculation
Turning the ceiling into a team target. The ceiling is a structural fact, not a sales goal. Pressuring the front desk to "reach the ceiling" just shifts a system problem onto people: gaps aren't filled with willpower, they're filled with reminders that get a response, recall that gets booked and demand captured in time.
Comparing your ceiling with another clinic's. That takes you straight back to the average problem: two clinics with identical ceilings can have completely different costs, treatment mixes and margins. The ceiling only makes sense compared with your own revenue, month after month.
Recalculating it every month. The ceiling changes when your structure changes (an extra chair, new opening hours), not every month. What you watch monthly is the distance: what occupancy you achieved and where the gaps came from. If the number you keep recalculating is the ceiling rather than the occupancy, you're watching the part of the calculation that doesn't move.
Billing more is not earning more
The ceiling talks about revenue and says nothing about margin. A clinic can get close to its ceiling and still earn little, because the structure that sustains those hours costs money every month. The honest next step after this calculation is the opposite one: knowing what each chair hour costs you and what occupancy you need just to cover costs. That calculation, with the same visible arithmetic, is in dental clinic profitability: how to know if you're really making money.
Does this work with your current software?
Every number in the calculation is already in your PMS, whether that's Gesden, Nubimed, Dentalink, Clinic Cloud or another: the schedule holds your hours and your gaps, the patient files show who hasn't visited in a year. What's usually missing isn't the data, but someone with the hours to work on occupancy every single day.
Keishal is an autonomous system that operates on top of the software you already use, with no migration. It reactivates the dormant base over WhatsApp, books recall, captures the demand that arrives out of hours and turns all that activity into the indicators in this article, calculated the same way every month. Your team only sees the results.
Start with your four numbers
This week, pull four numbers: chairs, the month's available hours, occupied hours and last month's revenue. With those you have your occupancy, your revenue per hour and your ceiling. It's an afternoon of work, and it answers a question no average can.
If you'd like to see that headroom calculated on your own database, book a demo and we'll show you with your numbers, not an average's.

Ready to try Keishal in your dental clinic?
Book a demo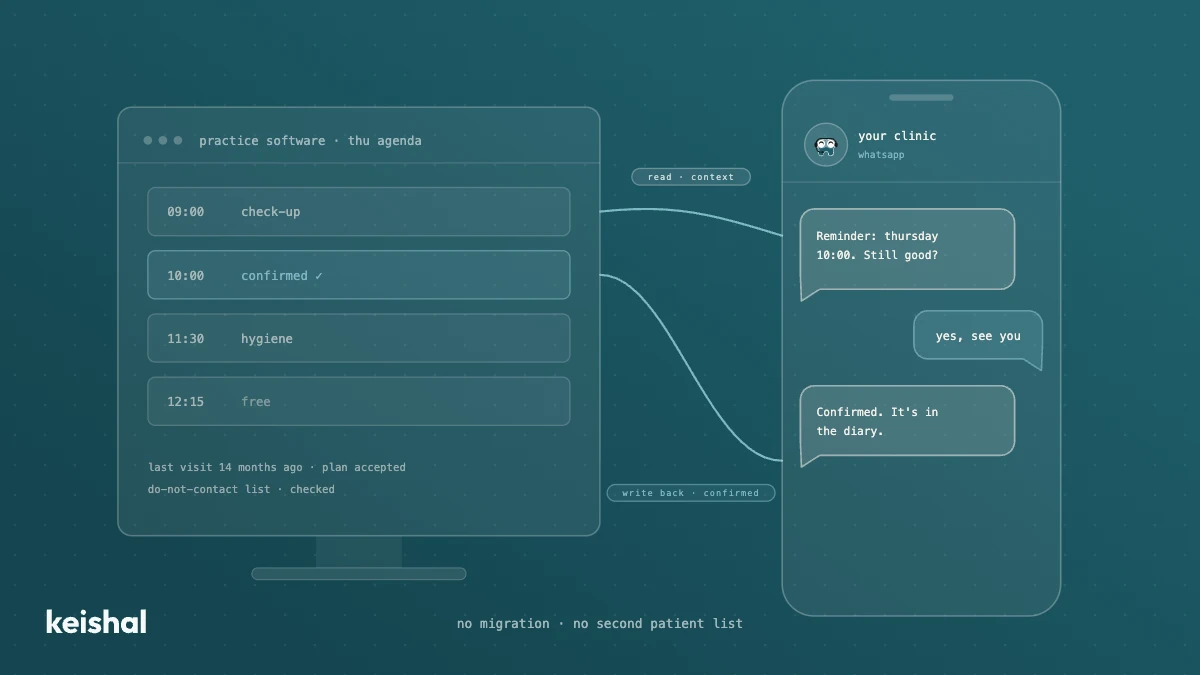
Integrating AI with your dental practice software: what a real connection means
A real integration with your dental clinic's software does two jobs: it reads your patients' data for context and writes appointments, confirmations and status changes back into your program. A monthly CSV, a calendar connector or a read-only tool leaves the rest to your team: with 330 reminders a month, marking each confirmation at 30 seconds adds up to almost 3 hours. Ask for the list of supported programs and versions in writing, and check that there's no migration and no duplicate patient base.
Switching dental software: what migrating really involves and when you don't need to
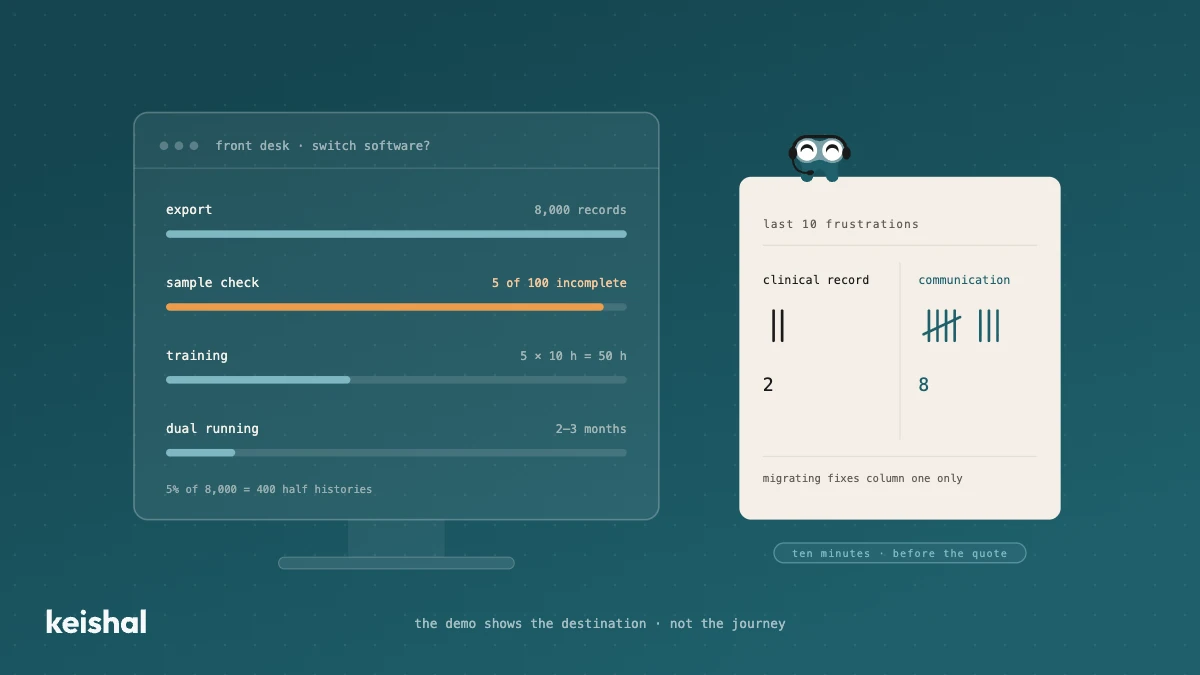
Switching dental software isn't installing a program: it's exporting and verifying thousands of records, training the team (5 people × 10 hours = 50 hours) and running two systems side by side for two or three months. It's worth it when the software has no support, holds your data hostage or the clinic has outgrown it. But if what's pushing you is unmanaged reminders, recall that never happens and out-of-hours messages, that communication layer can be added on top of your current PMS, without migrating anything.