
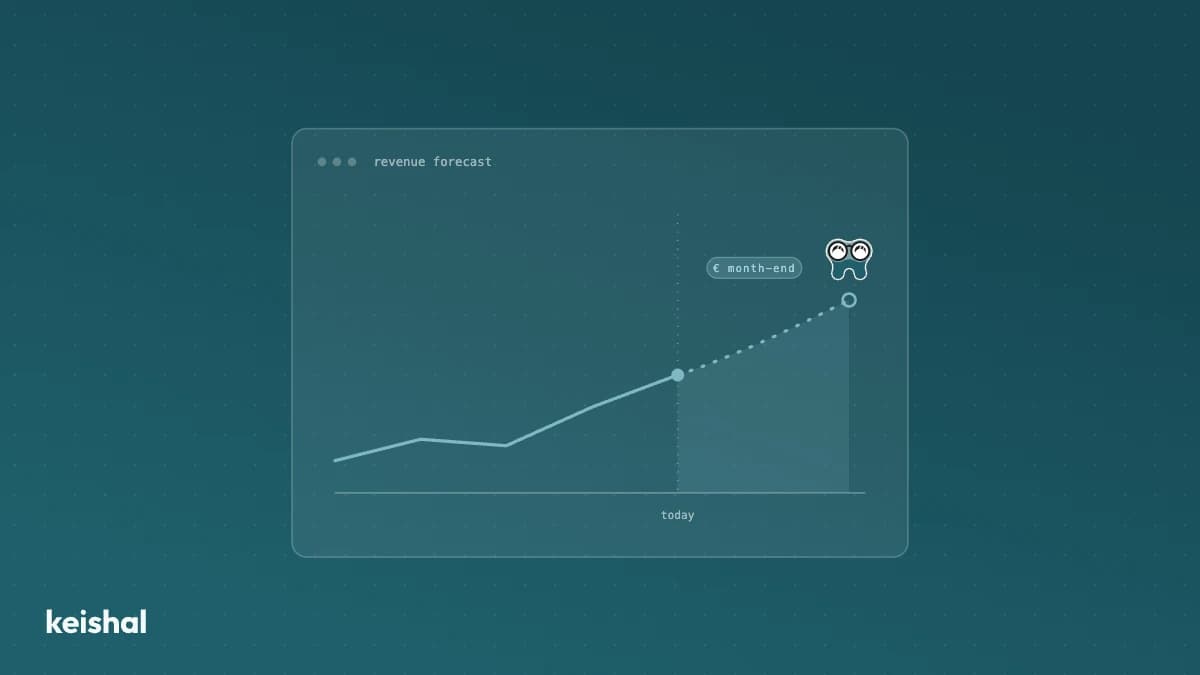
Next month's revenue forecast is a calculation from three numbers you already have: confirmed agenda times average ticket, adjusted for your drop-off rate, plus what your reactivation and recall will still generate. Example: 340 confirmed appointments, a 12% historical drop-off rate, and an 8% reactivation conversion on 220 contacts add up to a forecast of about €30,115. It's not a promise: it's arithmetic with your own numbers, and you can recalculate it every month.
Every month, around the 28th, someone at the clinic runs a mental version of this calculation: how many appointments are on the books, what each one usually brings in, and whether the month is going to be good or slow. The problem is that this calculation happens from memory, based on the feel of the month, not the actual numbers. And a feeling isn't enough to decide whether there's room to hire, buy new equipment, or wait another month.
Revenue forecasting for a dental clinic isn't a magic formula or an industry average. It's a calculation built from three things you already have: your confirmed agenda, your cancellation history, and your reactivation and recall activity. This guide is that calculation, step by step, with your own numbers.
Why this isn't the same as looking at your KPIs
If you already review your clinic's KPIs every month (dormant-base coverage, contact-to-booking conversion, off-hours bookings, contact data quality), you know what has happened. That's a dashboard that looks backward: how many patients you've reactivated, how your recall converted, how many bookings 24/7 booking absorbed. It's essential information, but it answers "what happened?", not "what's going to happen?".
Revenue forecasting looks forward. It takes that same activity (agenda, reactivation, recall) and turns it into an estimate of what you'll bill next month, before the month is over. That difference matters: a KPI tells you whether last month was good; a forecast tells you whether next month will be, with enough time to act if it won't.
The arithmetic of revenue forecasting: what you'll bill next month
Nobody can promise you an exact figure. But you can calculate a defensible range in three steps, using data that's already sitting in your practice management software.
Step 1: your safe base
Start with what's already on the agenda. Count the confirmed appointments for next month and multiply them by your average ticket (what your clinic bills on average per appointment, across check-ups, cleanings and treatments).
A round-number example: if you have 340 confirmed appointments and your average ticket is €95, your gross base is:
340 × €95 = €32,300
That figure is a starting point, not the final forecast. It hasn't yet passed through the most important filter: how many of those appointments will actually happen.
Step 2: adjust for your own drop-off rate
No clinic completes 100% of its confirmed agenda. There are cancellations, there are no-shows, and there are reschedules that fall outside the month. The right way to handle this isn't to guess a generic percentage — it's to look at your own history: of the appointments confirmed over the last three months, what share ended up not happening?
Say that share, for your clinic, is 12%. Applied to 340 confirmed appointments:
340 × 12% ≈ 41 appointments that will likely not be billed
340 − 41 = 299 real appointments
299 × €95 = €28,405
That figure is already far more honest than step 1's: it's your safe base, adjusted for how your agenda actually behaves, not how you'd like it to behave.
Step 3: add what isn't on the agenda yet
This is where the forecast stops being only "what's already confirmed" and starts including what your reactivation and recall activity will generate before the month ends. If you contact dormant patients periodically or run recall systematically, some of those contacts convert into an appointment, even though it isn't on the agenda yet on the day you're doing the math.
The figure you need is the same one you should already be tracking as a KPI: your contact-to-booking conversion rate. Count, out of the last 100 patients contacted for reactivation or recall, how many ended up booking. If that number is, say, 8%, and you're going to contact 220 dormant patients this month:
220 × 8% ≈ 18 additional appointments, not confirmed yet but foreseeable
18 × €95 = €1,710
The result: your full forecast
Adding the safe base and the reactivation forecast:
299 + 18 = 317 expected appointments
€28,405 + €1,710 ≈ €30,115 forecast for next month
That figure isn't a promise. It's an estimate built from three verifiable numbers from your own clinic: agenda, drop-off history, and reactivation conversion. If someone asked where it came from, you could answer in one sentence — and that's exactly what makes it useful.
What this number is actually good for
A forecast calculated on the 20th or 25th of the month is good for one specific thing: making a decision while there's still time to act on it. If the forecast comes in below usual, there are still days left to push reactivation of dormant patients harder, check for agenda gaps that can be filled, or simply adjust expectations before the surprise lands on the 1st.
The three moments where this calculation tends to make a real difference:
- Deciding whether there's room to hire or extend hours. A forecast that's stable across several months, not one lucky month, is what backs that decision with data instead of intuition.
- Spotting a slow month with time to react. If mid-month the forecast is clearly running below average, there's still time to intensify recall or review the second half of the month's agenda.
- Explaining the month to someone who isn't in the day-to-day. A partner, an outside manager, or the dentist-owner when they're away from the clinic all appreciate a number with a calculation behind it, not a feeling of "this month is going fine" or "this month is slow".
It's the line we hear most often in 2026 from clinics that have been running this calculation for a few months: "we used to decide by gut feeling; now, on the 20th, I know whether I can wait until next month or need to act now" (a pattern from conversations with customer clinics, not a verbatim quote from one specific clinic).
Common mistakes when running this calculation
The most frequent mistake is using the whole year's average ticket in a month with a different treatment mix than usual — a month with more orthodontics scheduled than normal, for example. If your clinic has service lines with very different tickets, it's worth calculating an average ticket per appointment type instead of one number for the whole agenda.
The second mistake is applying a generic drop-off rate instead of your own. "The industry average" isn't your clinic: a clinic with automated WhatsApp reminders almost always has far fewer last-minute drop-offs than one that only calls by phone. Using your own figure, not someone else's, is what makes the forecast defensible.
What this calculation can't tell you
No forecast, however sophisticated, removes the uncertainty. Some patients confirmed today will cancel at the last minute for reasons you can't predict; some of the patients you contact for reactivation will take longer than a month to decide, and will show up in next month's forecast instead of this one. The value of the calculation isn't getting the euro figure exactly right — it's having a number to work with instead of a feeling.
It's worth checking the margin of error every month: compare what you forecast against what you actually billed, and update your drop-off rate and conversion rate with the most recent data. After two or three months of comparison, the forecast tightens on its own.
This also isn't a profitability forecast. Revenue and profit aren't the same thing: to know what you actually keep, you'd need to subtract fixed and variable costs from this figure, and those aren't part of this calculation. Revenue forecasting is the first piece of that bigger sum, not the whole thing.
One more question the forecast can't answer: what you could be billing. That other number, your structure's ceiling, has its own calculation in how much a dental clinic makes: the forecast tells you what you'll bill; the ceiling, how much room you have left.
From manual calculation to automatic report
All of the above can be done with a spreadsheet and an export from your practice management software, and plenty of clinics already do exactly that, one weekend a month. The problem isn't that the calculation is complicated. It's that it depends on someone remembering to do it, cross-referencing three separate data sources by hand, and repeating it every month without fail.
An autonomous system like Keishal already holds the three numbers this calculation needs, because it's the same system running your clinic's patient reactivation and recall: it knows how many appointments are confirmed, how many patients it has contacted, and how many of those contacts have historically converted into a booking. Revenue forecasting turns those three numbers into the same calculation you just did by hand, refreshed every week instead of once a month, with nobody having to export anything. It's one more of the three blocks of a dental clinic's administrative work the system already covers.
This builds on the same foundation covered in dental clinic KPIs: results analytics tells you what's already happened, forecasting tells you what's coming, and both depend on your contact data being clean and up to date. If a third of the phone numbers in your database are wrong, the forecast inherits that error.
If you want to see what this forecast looks like with your own clinic's real numbers, book a demo and we'll walk through the calculation applied to your own agenda.

Ready to try Keishal in your dental clinic?
Book a demo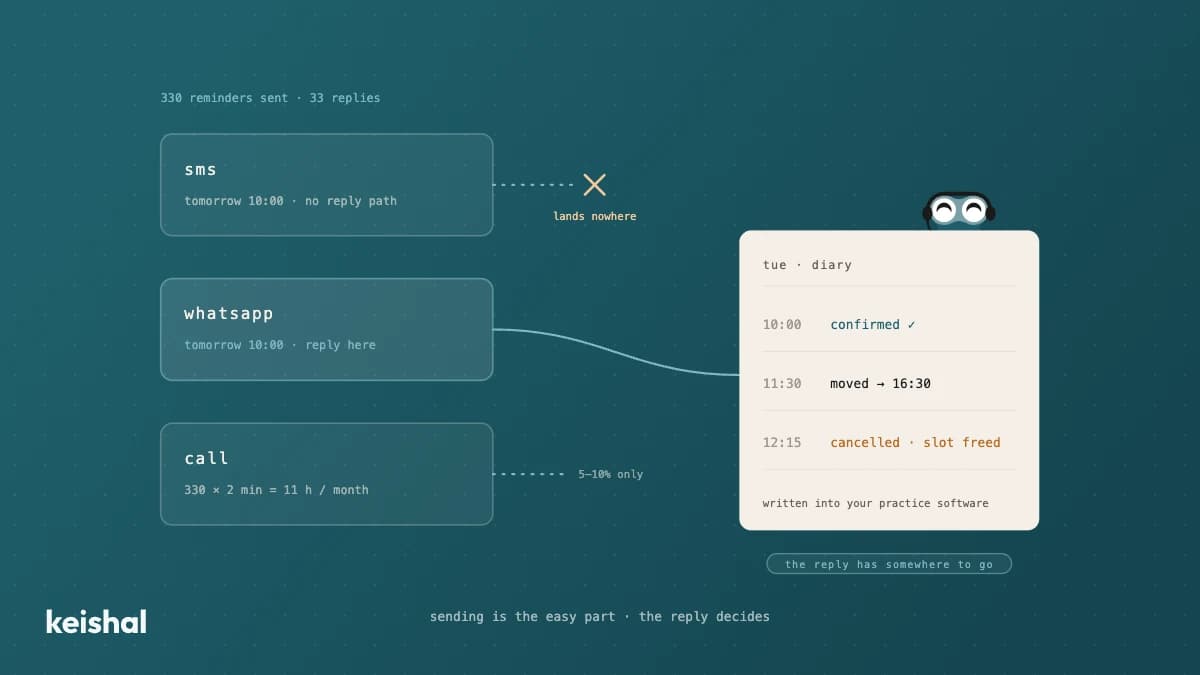
Appointment reminders for your dental clinic: SMS, WhatsApp or phone call
A diary with 15 appointments a day across 22 working days generates 330 reminders a month. If one patient in ten replies, that's 33 conversations someone has to handle: confirmations, reschedules, cancellations that open a slot. That's why the channel matters less than the reply: SMS notifies but rarely listens, WhatsApp resolves things in the same thread, and the phone call is for the cases that need it. In 2026, the real purchase decision isn't "which channel do I buy?" but "who handles what patients reply?".
Virtual phone system for dental clinics: what it solves and what keeps ringing
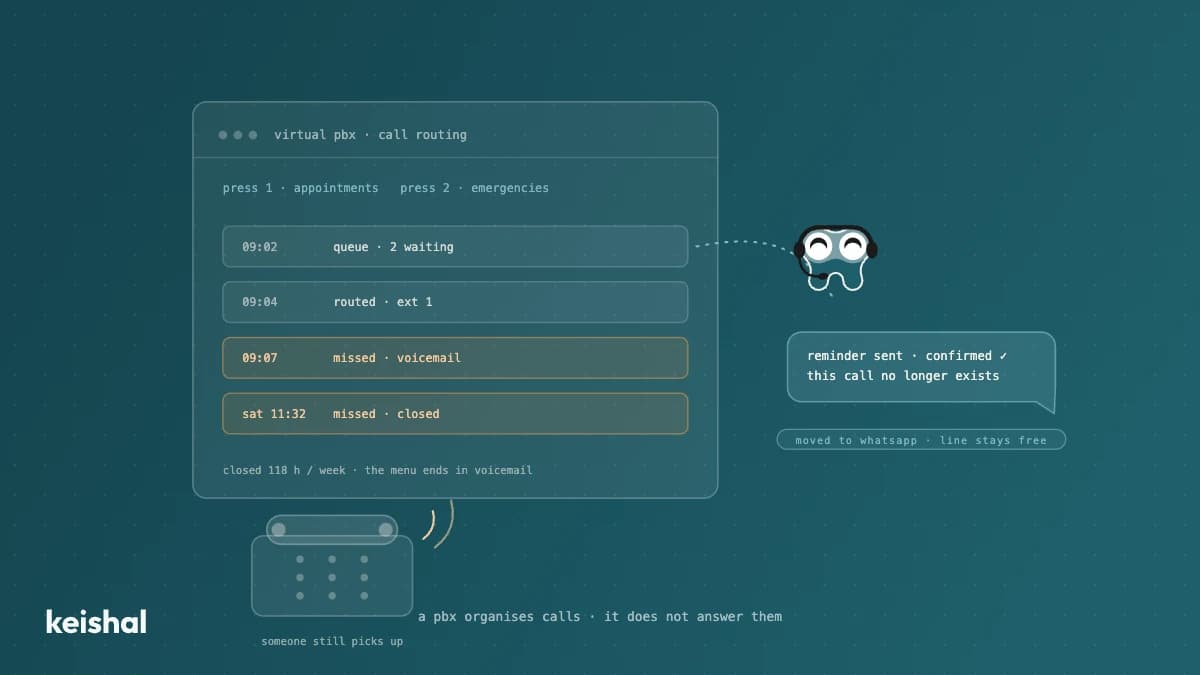
A virtual phone system organises your dental clinic's calls: voice menus, hold queues, forwarding and missed-call logs. What it doesn't do is answer them: someone still picks up, and with 50 opening hours the clinic is closed for 118 of the week's 168 hours (70 %). It makes sense with several locations or lines, or when calls are lost to saturation. If the problem is volume — 40 calls × 3 minutes = 2 hours a day — the higher-leverage move is migrating repetitive tasks (reminders, bookings, questions) to WhatsApp and keeping the phone for the conversations that need it.